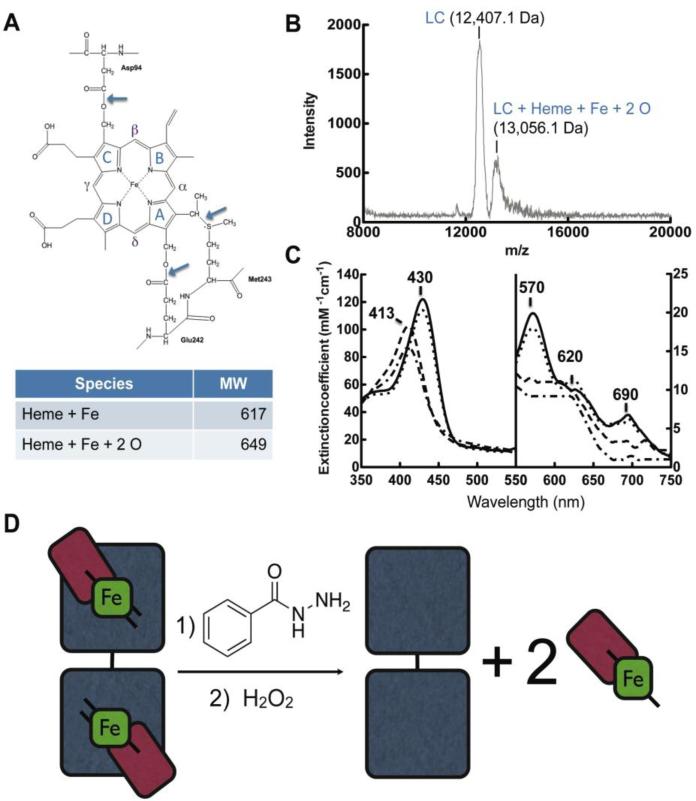
Fig. 7. Sequential hydrolysis of ester bonds results in cleavage of the catalytic heme from MPO active site.
A, Structure and nomenclature of the tetrapyrrole ring of the heme in the MPO active site. Figure adapted from (Kooter IM, 1999). B, Maldi-TOF mass spectroscopy analysis of reactions under conditions that maximize light chain-heme product formation, namely MPO (1.2 μM) with BAH (2.5 mM) pre-incubated for 10 min prior to the addition of H2O2 (20 μM). These reactions are identical to those in lane 6 in Fig. 6. C, Spectroscopic analysis of MPO heme signature following addition of BAH. Curves represent MPO (black line), MPO with hydrazide (dotted), MPO with hydrazide post H2O2 addition after 10 min (dashed) and again after 1hr (dot-dashed). D, Schematic representation of the release of the active site heme from MPO by reaction with BAH and H2O2. MPO subunits are shown as light chain (red), heme (green) and heavy chain (gray).

