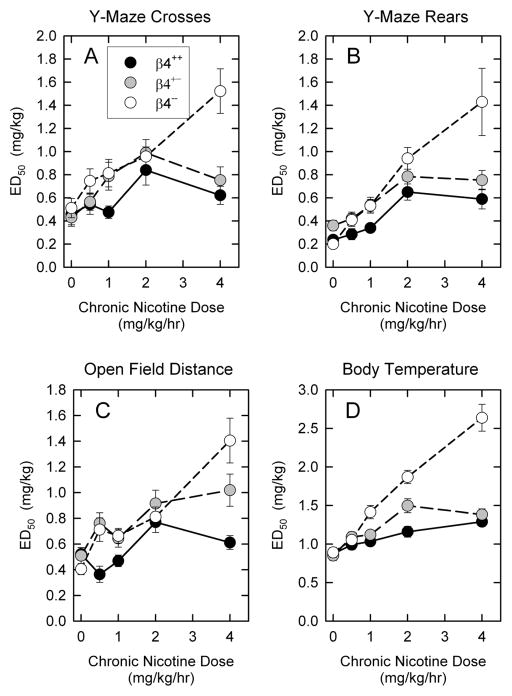
Figure 2. ED50 values following chronic nicotine treatment for mice differing in β4 genotype.
Mean ± SEM of ED50 values calculated by non-linear least squares curve fits for dose-response curves from each of the four tests for β4++, β4+− and β4−− that had been chronically treated with the indicated doses of nicotine.

