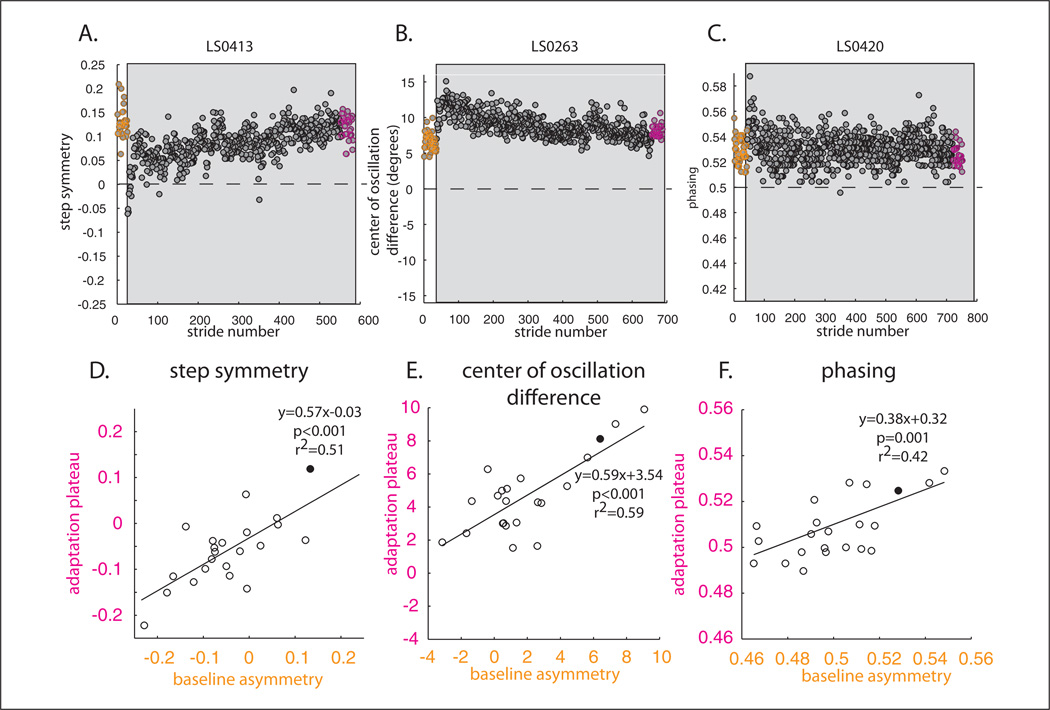
Figure 4.
Comparison of baseline asymmetries and adaptation plateaus. Here, individual baseline asymmetries are not subtracted out from adaptation and de-adaptation data; therefore, zero represents absolute symmetry. Adaptation is highlighted in the gray area. (A) Example subject’s baseline and adaptation shown stride-by-stride. The orange circles represent baseline walking. Adaptation plateau (last 30 strides) is highlighted in pink. Note in this example, that the split-belts caused the subject to walk symmetrically early in adaptation (ie, step symmetry is zero in the first strides of adaptation). Rather than maintaining this symmetric gait, the subject returns toward his baseline asymmetry (ie, pink and orange circles are equal). (B) Example subject of center of oscillation difference. Once again subject returns close to baseline symmetry by the end of adaptation; however, this subject was perturbed in the opposite direction. Split-belts caused the subject to initially be more asymmetric early in adaptation. (C) Phasing example similar to panel B. Remaining panels display how individual subjects’ baseline asymmetries correlated with adaptation plateaus for step symmetry (D), center of oscillation difference (E), and phasing (F). Example subjects are shown as the filled circles. Note that only the specific parameter’s baseline correlates with the adaptation plateau.

