
Figure 4.2.
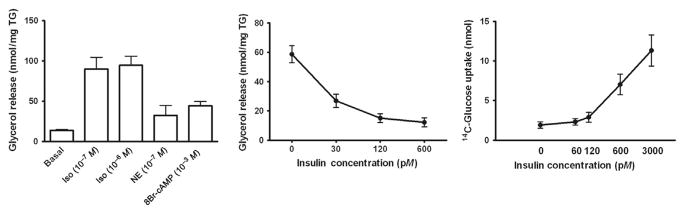
Metabolic phenotypes of newly differentiated human adipocytes. Lipolytic rates, basal and in response to isoproterenol (Iso), norepinephrine (NE), or 8-bromo-cAMP (A) and in response to insulin (B), are measured on d14 of differentiation. Basal lipolysis was measured in the conditions of 1 units/ml ADA +20 nM PIA. Inhibition of lipolysis by insulin was measured against 8-bromo-cAMP (1 mM)-stimulated conditions. (C) The rates of 14C-2-deoxy-glucose uptake were measured after 3–4 h of starvation at 0, 60, 120, 600, and 3000 pM insulin concentrations. Data are obtained from sc ASCs derived from five independent subjects. Some of these data have been published (Lee & Fried, 2012; Lee et al., 2012).