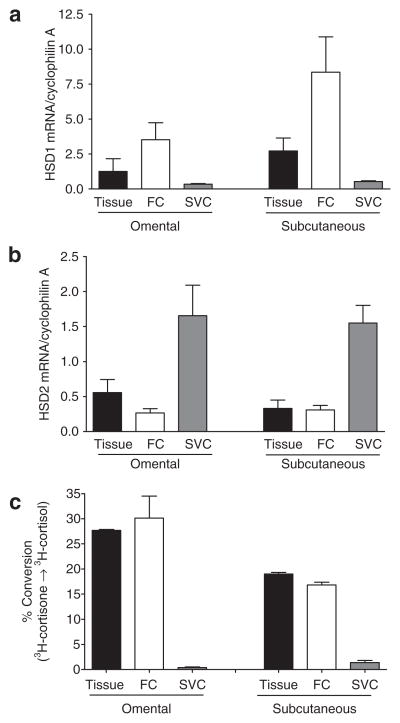
Figure 2.
Comparison of (a) HSD1 and (b) HSD 2 mRNA levels in adipose tissue, adipocytes (fat cells (FCs)) or stromal vascular cells (SVCs). Adipocytes and SVCs were prepared by collagenase digestion of human omental and subcutaneous adipose tissue (1 man and 6 women, BMI = 35.3 ± 2.4 (25–41), age = 47.7 ± 6.3 (26–63)). Relative expression levels of (a) HSD1 and (b) HSD2 were quantified relative to the control cyclophilin A by quantitative real-time PCR. (c) HSD reductase activity in tissue fragments, adipocyte or SVCs. Reductase activity of HSD1 was assessed by measuring the conversion of 3H-cortisone to 3H-cortisol in tissue fragments and cell fractions (n = 2). Data for tissue and cell fractions were normalized to tissue or adipocyte lipid. HSD1, type 1 hydroxysteroid dehydrogenase.

