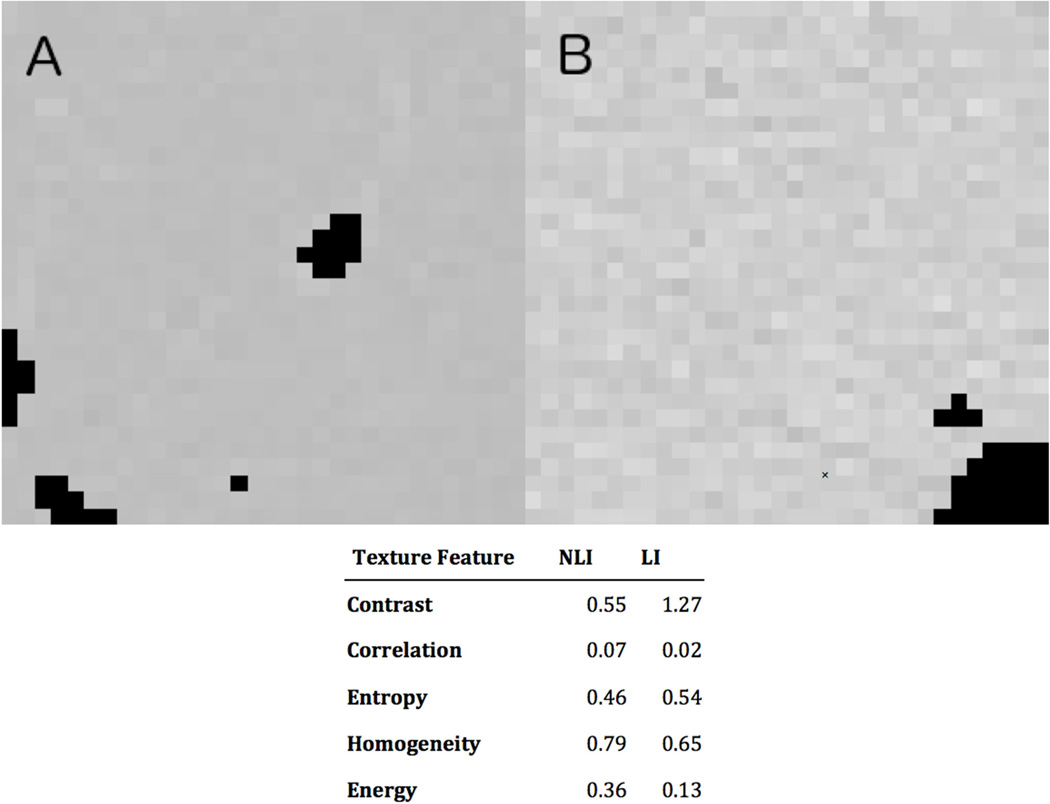
Fig. 3.
Comparison of 32 × 32 preoperative CT textures (pixel distance = 24). (A) Patient with no postoperative liver insufficiency and (B) Patient with postoperative liver insufficiency. Black areas indicate non-parenchymal regions (vessels, tumors, cysts) excluded from analysis. NLI, no liver insufficiency; LI, liver insufficiency.

