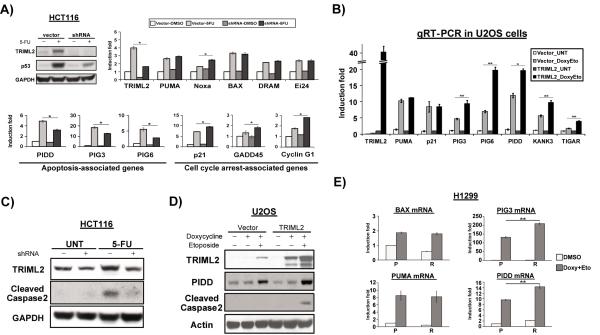
Figure 4. TRIML2 influences the transcriptional potential of p53.
(A) Upper left panel: western blot analysis of TRIML2 and p53 in Hct116 cells stably-infected with vector alone or sh-A of TRIML2, and treated with 5-FU (5μM) for 72 hours. Upper right panel: qRT-PCR analysis of the samples in (A) for p53 pro-apoptotic target genes that are not downregulated by TRIML2 silencing. Bottom panel: selective p53 target genes whose expression was affected by TRIML2 knockdown. The data depicted are the averaged results from three independent experiments, normalized to control (cyclophilin A); error bars mark standard error. The asterisk denotes a p-value <0.05.
(B) qRT-PCR analysis of the levels of TRIML2-regulated p53 target genes in U2OS cells containing doxycycline-inducible vector alone (vector) or doxycycline-inducible TRIML2, following treatment with 0.75 μg/mL doxycycline, and 100 μM etoposide for twenty-four hours. The level of each gene in untreated, TRIML2-overexpressing cells was set to 1-fold and the data are normalized to cyclophilin A. The data depicted are the averaged results from three independent experiments; error bars mark standard error. The asterisk (*) denotes p<0.05, and the double asterisk (**) denotes p<0.005.
(C) Western blot analysis for TRIML2 and cleaved caspase-2 in Hct116 cells stably-infected with vector alone or sh-A of TRIML2, and treated with 5-FU (5μM) for 48 hours. The data depicted are representative of three independent experiments.
(D) Western blot analysis for TRIML2, PIDD and cleaved caspase-2 in U2OS cells containing doxycycline-inducible vector alone (vector) or doxycycline-inducible TRIML2, following treatment with 0.75 μg/mL doxycycline and 100 μM etoposide for twenty-four hours. Actin serves as the loading control; the data depicted are representative of three independent experiments.
(E) qRT-PCR analysis of the levels of BAX, PIG3, BBC3 (Puma) and PIDD in H1299 cells with tetracycline-inducible P72 or R72, following treatment with 0.75 μg/mL doxycycline plus 100 μM etoposide for twenty-four hours. The level of each gene in DMSO-treated P72 cells was set to 1 and the data are normalized to cyclophilin A. The data depicted are the averaged results from three independent experiments; error bars mark standard error. The double asterisk (**) denotes p<0.005. P=P72, R=R72. Doxy = doxycycline. Eto = etoposide.

