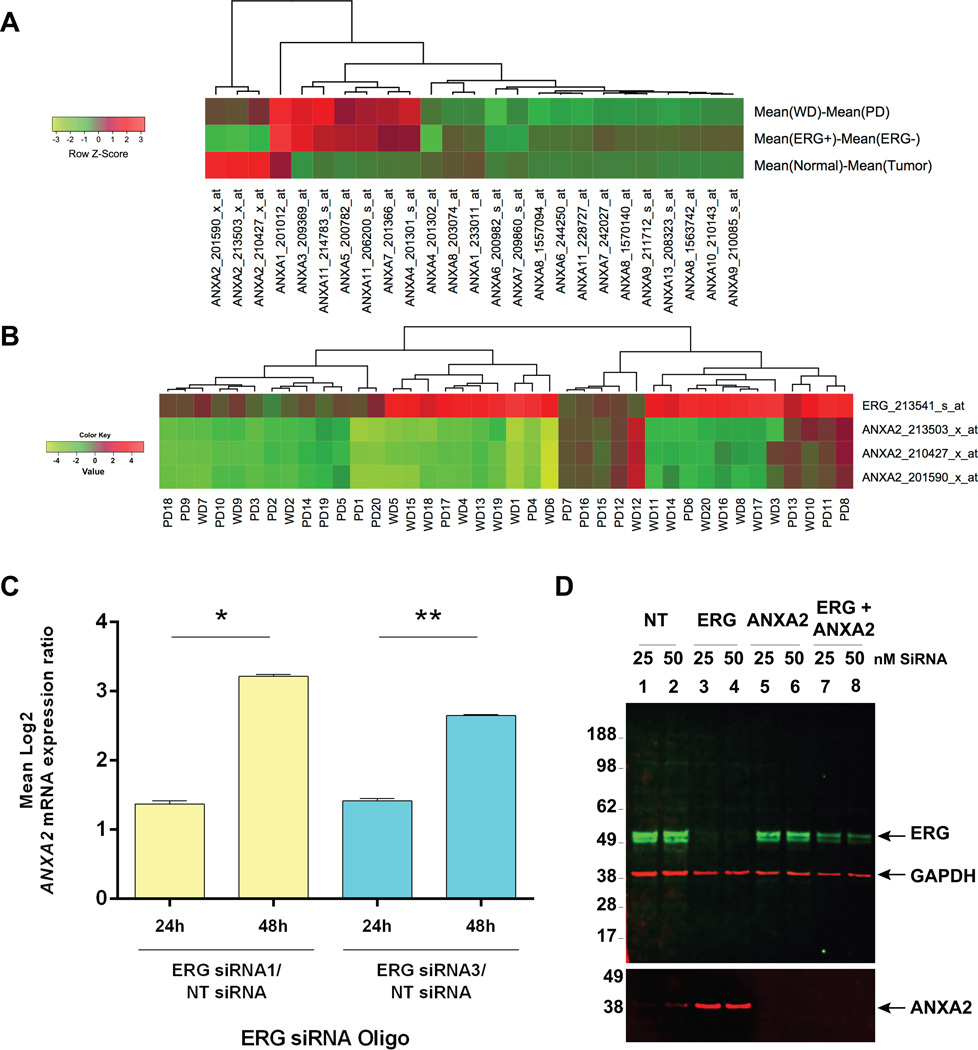
Figure 1. Gene expression analysis of 40 patients (20 WD and 20 PD) showed inverse correlation of gene expression between ERG and ANXA2.
Mean differences of mRNA expression between WD and PD, ERG(+) and ERG(−), as well as normal and tumor samples for members of the ANNEXIN family (A). Tumor vs. normal expression ratios ofERG and ANXA2 in 20 WD and 20 PD tumors showed an inverse correlation (B). Results from GeneChip analysis of VCaP cells, 24 and 48 h after ERG siRNA knock-down showing ratios of ANXA2 expression for ERG/NT siRNA, averaged from three ANXA2 probe sets, 213503_x_at, 201590_x_at and 210427_x_at. (Two-tailed Student’s T-test, *p- value=6.38×10⁻⁶; **p-value=4.51×10⁻⁵) (C). Immunoblot assay of lysates from VCaP cells 72 h after transfection with 25 or 50 nM of ERG, ANXA2 or combined ERG and ANXA2 siRNA oligos (D).

