
Figure 2.
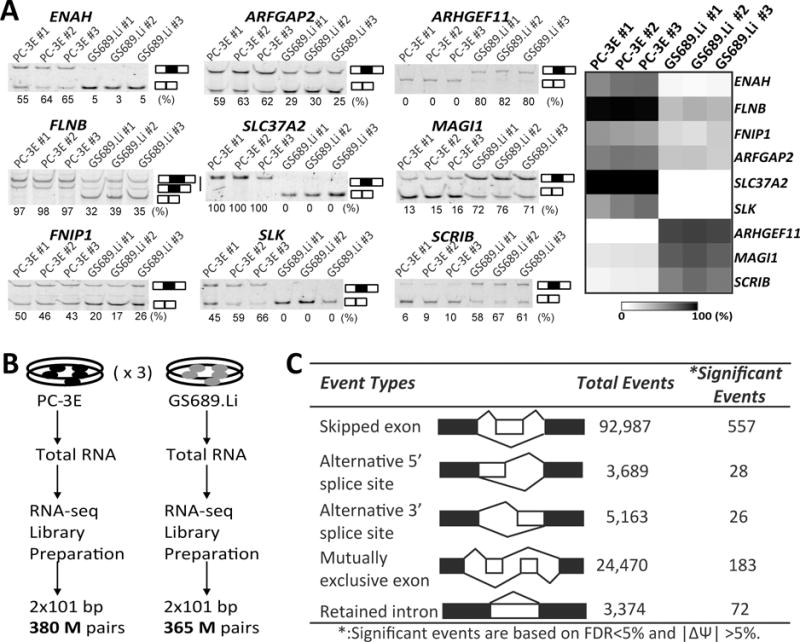
Comparison of AS profiles between the PC-3E and GS689.Li cell lines.
(A) RT-PCR based exon inclusion levels of nine EMT signature exons in PC-3E and GS689.Li. Left panel: fluorescently labeled RT-PCR gel images; the estimated exon inclusion levels are indicated below each gel picture. Right panel: heatmap of nine exons’ exon inclusion levels. (B) Flowchart of RNA-seq analysis of PC-3E and GS689.Li. (C) Summary of differential AS events detected between PC-3E and GS689.Li.