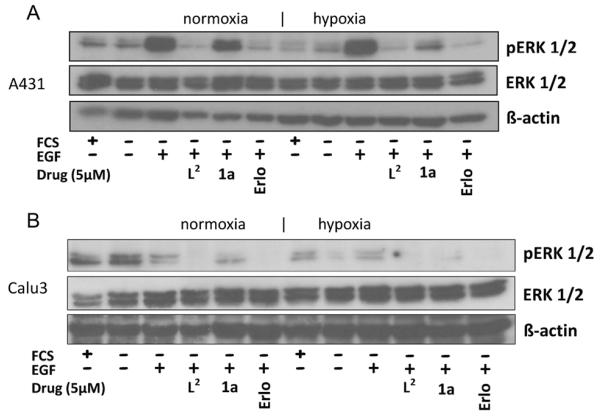
Figure 7.
Impact of hypoxia on the EGFR-inhibitory potential of L2, 1a, and erlotinib. A) A431 and B) Calu3 cells were grown in medium with (+) or without (−) FCS and treated with 5 μm of the indicated drugs for 4 h. After EGFR stimulation with 50 ng mL −1 EGF for 15 min, the cells were harvested and lysed, and the phosphorylation levels of ERK1/2 as well as total ERK1/2 were determined by Western blotting. The respective EGFR blots are shown in Figure S5A.

