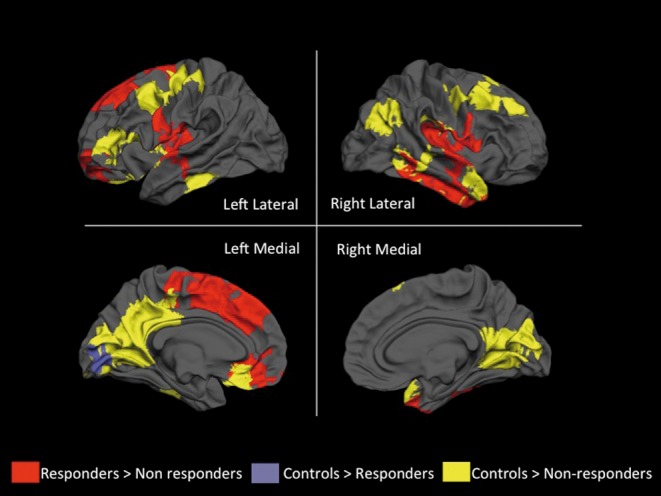
Figure 2. Voxel clusters showing differences in gyrification among responders, nonresponders, and healthy controls. Clusters of spatially contiguous suprathreshold voxels indicating higher gyrification for each between-group comparison are displayed in red, yellow, and purple. There were no clusters of reduced gyrification in these between-group comparisons. All clusters are displayed on a reconstructed average white matter surface (fsaverage in the FreeSurfer software) and sun/ived multiple testing using Monte Carlo simulation with a cluster inclusion criterion of P=0.05. The left hemisphere is on the left side of the image, and the right hemisphere is on the right side. The exact values of dusterwise probability for the clusters are presented in Table III. From reference 32: Paianiyappan L, Marques TR, Taylor H, et al Cortical folding defects as markers of poor treatment response in first-episode psychosis. JAMA Psychiatry. 2013;70:1031-1040. Copyright © 2013, American Medical Association.

