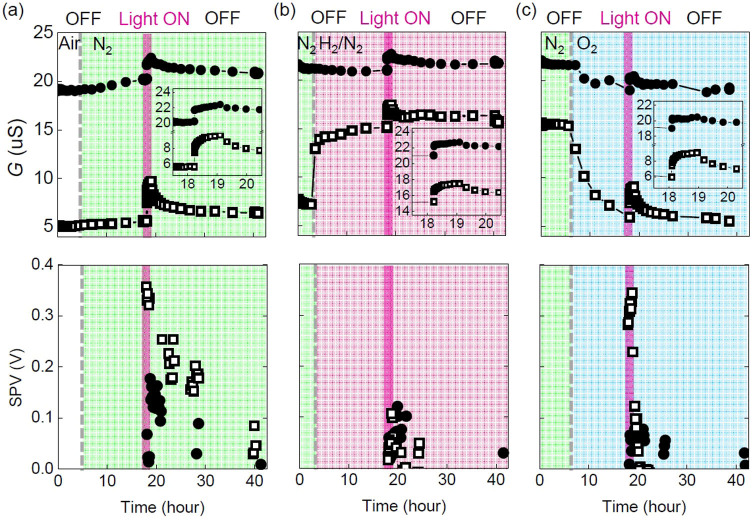
Figure 2. UV response, conductance (G) and surface photovoltage (SPV) of LAO/STO ( ) and Pd/LAO/STO (
 ) in (a) N2, (b) H2/N2, and (c) O2.
The gray dashed lines and the purple bars indicate the time when gas exchange starts and the period of UV light illumination (1 hour), respectively. The insets in (a)–(c) clearly show saturation behaviors of G under UV illumination.

