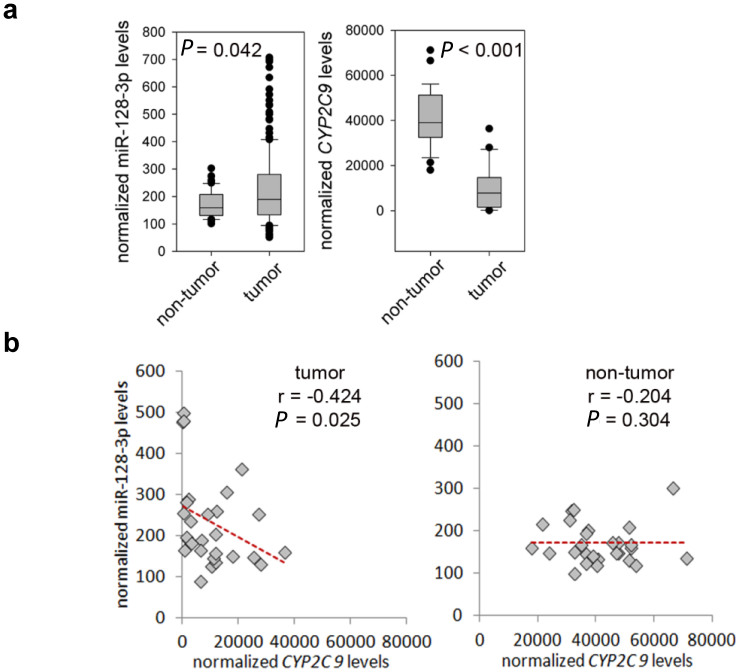
Figure 5. Relationship between CYP2C9 mRNA expression and hsa-miR-128-3p level in HCC and paired non-tumor tissues.
(a) Expression data from HCC tumor and non-tumor samples stored in The Cancer Genome Atlas (TCGA) was downloaded and compared using the Rank Sum Test. There were 28 and 27 tumor and non-tumor samples respectively that had expression data for hsa-miR-128-3p and CYP2C9. Data has been normalized to reads per million. (b) hsa-miR-128-3p levels correlate with CYP2C9 levels in tumor tissues (r = −0.424, P = 0.025, 28 matched tumor samples), but there is no significant correlation in the non-tumor tissues (r = −0.204, P = 0.304, 27 matched non-tumor samples).

