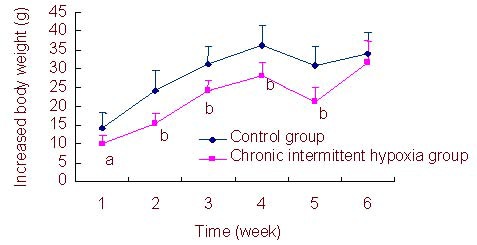
Figure 1.

Comparison of increased body weight per week in each group for 6 weeks.
Data are expressed as mean ± SD of ten rats in each group per week. aP < 0.05, bP < 0.01, vs. control group (independent-samples t-test). Body weight gain = the measured body weight on the tested week – the measured body weight on the previous week.
