. 2015 Jan-Feb;12(1):83–88. doi: 10.4103/1735-3327.150339
Copyright: © Dental Research Journal
This is an open-access article distributed under the terms of the Creative Commons Attribution-Noncommercial-Share Alike 3.0 Unported, which permits unrestricted use, distribution, and reproduction in any medium, provided the original work is properly cited.
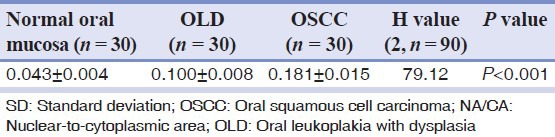
Table 3.
Summary (mean ± SD) of NA/CA ratio of 3 groups