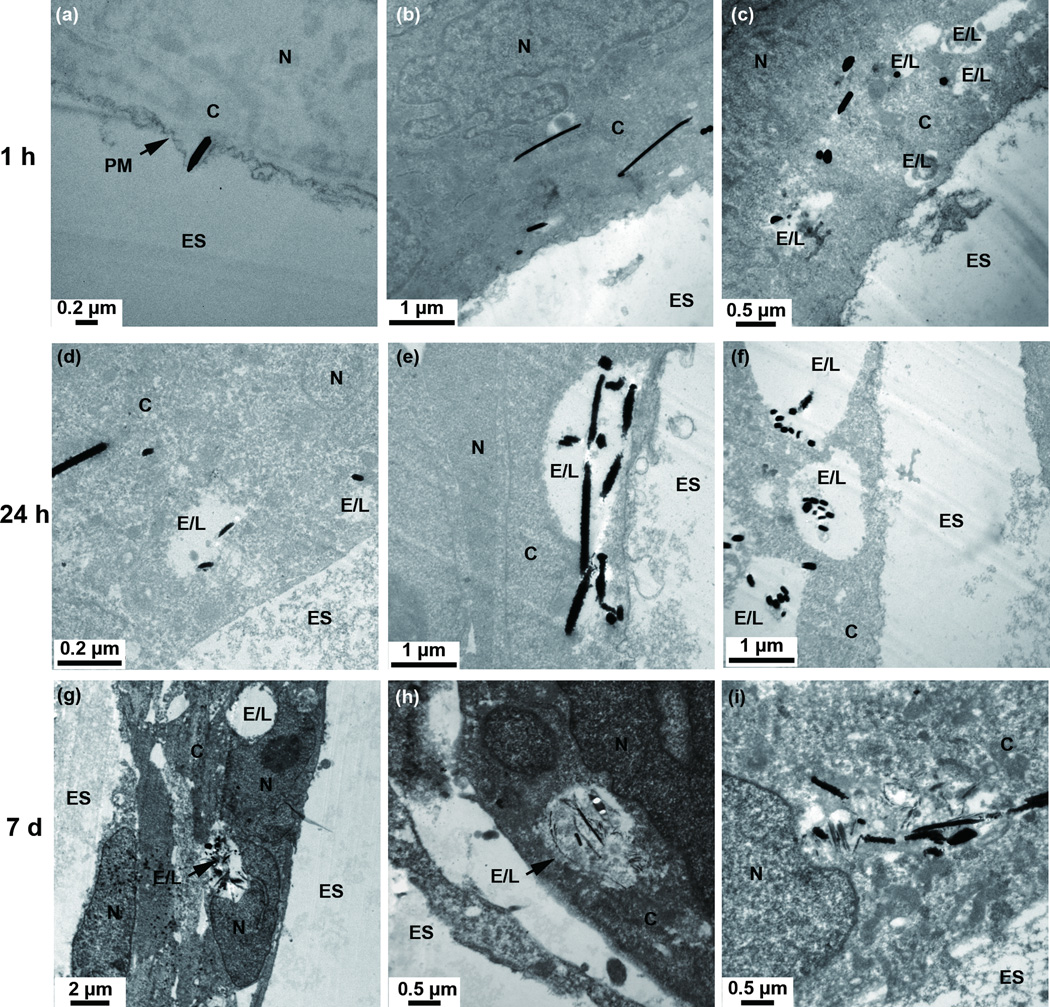
Figure 2.
TEM images showing the cellular distribution of AgNWs in TT1 epithelial cells after 1 h (a-c), 24 h (d-f) and 7 days (g-i) exposure ES = extracellular space; C = cytoplasm; E/L: endosome/lysosome; N = nucleus; PM = plasma membrane. Images (b-i) are TEM sections post-stained with uranyl acetate and lead citrate.

