
Fig. 5.
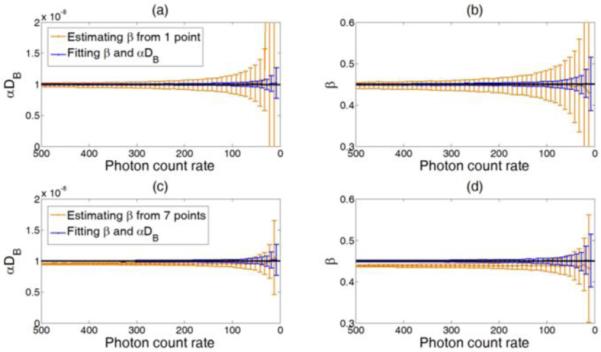
Comparison of the two methods for extracting β and αDB from the simulated g20 curves under different noise levels (i.e., the photon count rate changes from 500 kcps to 20 kcps). Dashed lines indicate the expected values (β = 0.45 and αDB = 1 × 10⁻⁸ cm2/s). For both methods, the standard deviation (error bar) of the fitted values increased with the increase of noise level. Fitting β and αDB simultaneously resulted in unbiased and more accurate estimation of the means and smaller standard deviations compared to the two-step fitting method. When estimating β from the first point (a and b), the standard deviations of β and αDB were large. Estimating β from more points (c and d) reduced the standard deviations of estimation with the cost of estimation biases in β and αDB.