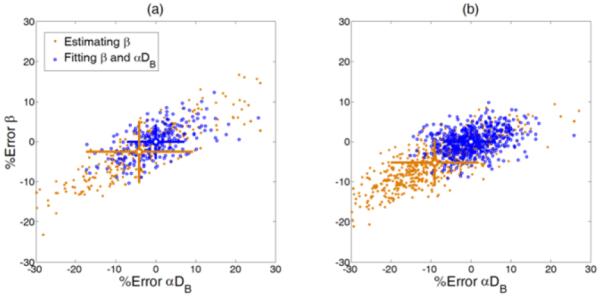
Fig. 6.

The performance of the two fitting methods evaluated with the (a) phantom test and (b) in-vivo measurement. The mean values obtained by the simultaneous fitting method were assumed as ‘true’ values, and the discrepancies between the values extracted using the simultaneously fitting method or two-step fitting method are presented as percentage errors. The error bars are shown with crosses respectively and the mean values are located at the center of the crosses.
