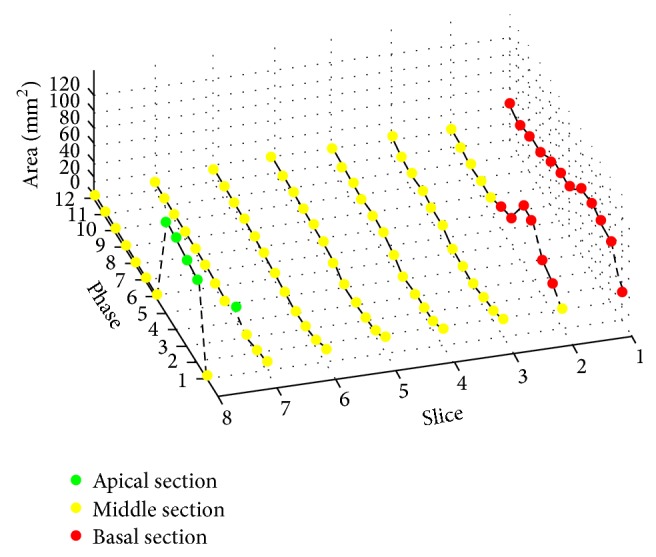
Figure 3.

Circles represent the corresponding area of LV region shown in Figure 2. There are 8 slices and 12 phases, and the middle slice number is 4. The areas from slices 3 to 7 (yellow) vary smoothly in slice and phase axes, demonstrating spatiotemporal continuity. This continuity stops at slices 7 and 8 (green) and slices 1 and 2 (red), where there are abrupt increases in LV areas as Step 1 leaks out of the apex (slice 7) and basal slice (slice 2).
