
Figure 2.
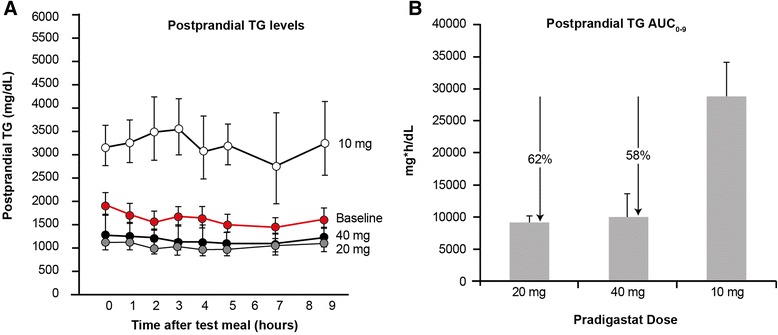
Postprandial plasma triglyceride levels during the treatment with pradigastat at different doses. Footnote: Data presented as geometric mean ± standard error of mean (SEM). Percentage change compared with the 10 mg dose for postprandial TG AUC0–9 are shown by ‘↓’. TG, triglycerides; AUC0–9, area under curve over 0 to 9 hours of meal tolerance test. Panel A = TG concentration/time profile over 9 hours, Panel B = TG AUC0-9.