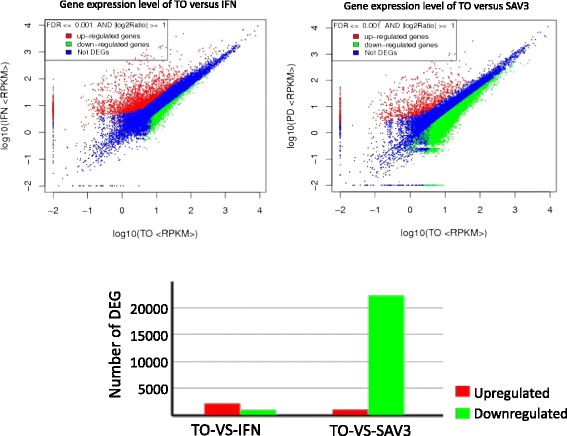
Figure 3.

Shows changes in the levels of differentially expressed genes (DEGs) for the TO-VS-IFN and TO-VS-SAV3. Only DEGs with a threshold of a false discovery rate (FDR) <0.001 and absolute value log2ratio > 1 were considered differentially expressed.
