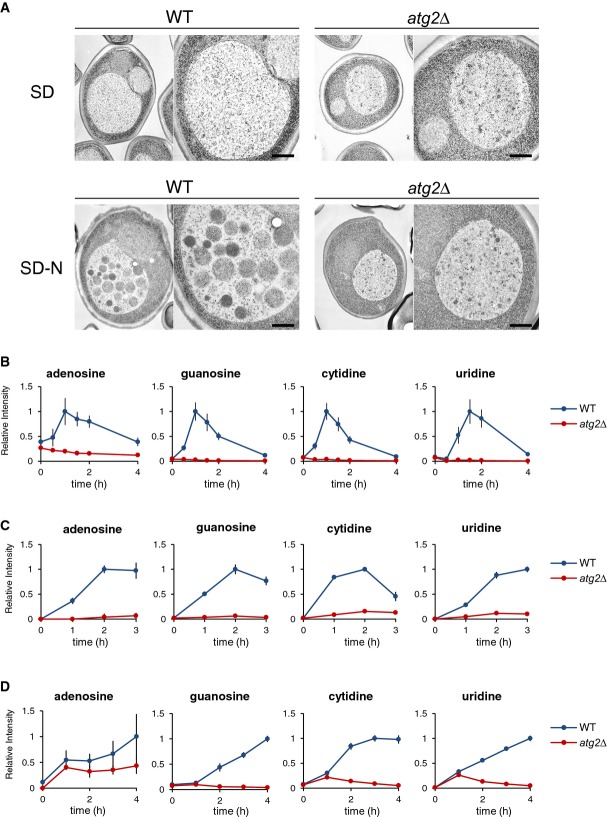
Figure 1. Dynamics of intracellular nucleosides under starvation.
- A Electron microscopic analyses to see autophagic bodies in the vacuoles under both growth and nitrogen starvation conditions. Autophagic bodies typically contain cytosolic ribosomes. pep4Δprb1Δ and pep4Δprb1Δatg2Δ cells were grown in SD to mid-log phase (OD600 = 1) and transferred to SD(-N) for 5 h. The cells were examined by transmission electron microscopy as described in Materials and Methods. Scale bar, 500 nm.
- B–D Time-dependent changes in nucleoside contents under nitrogen starvation (B), rapamycin treatment (C), and carbon starvation (D) conditions. Wild-type and atg2Δ cells were grown in SD and transferred to SD(-N), SD medium with 0.2 μM rapamycin, or SD(-C) at time 0. At the indicated time points, nucleosides were analyzed by LC/MS as described in Materials and Methods. Results are presented as normalized intensities on the basis of peak height of each metabolite in wild-type cells. All data are means of triplicate samples. The error bars represent the standard deviation.

