
Figure 5. Evaluation of ribophagy on RNA degradation under nitrogen starvation.
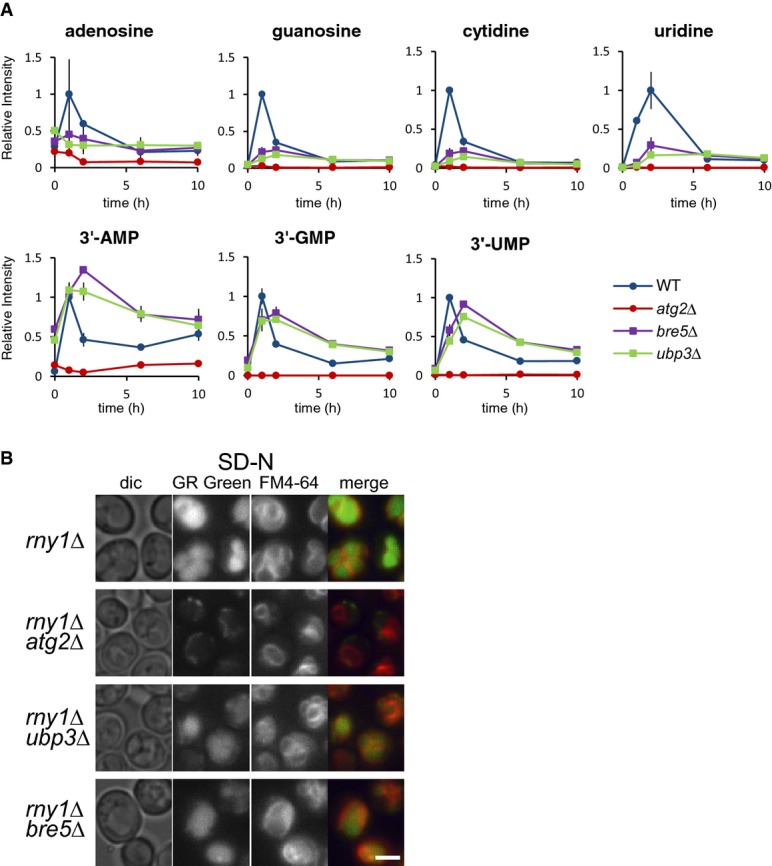
- Time-dependent change in nucleoside levels after nitrogen starvation. Wild-type, atg2Δ, ubp3Δ, and bre5Δ cells were grown in SD to mid-log phase and transferred to SD(-N) at time 0. Metabolites were analyzed by LC/MS as described in Materials and Methods. The results are presented as normalized intensities on the basis of the peak height of each metabolite in wild-type cells. All data are means of triplicates. The error bars represent the standard deviation.
- Detection of free RNA within cells. rny1Δ, rny1Δatg2Δ, rny1Δubp3Δ, and rny1Δbre5Δ cells grown in SD(-N) for 2 h were stained with FM4-64 and GR Green and observed under a fluorescence microscope. Scale bar, 5 μm.