
Figure 7. RNA degradation via autophagy in S. pombe.
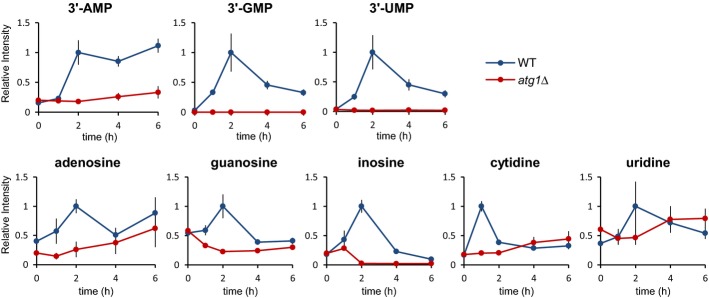
Wild-type and atg1Δ of S. pombe were grown in SD to mid-log phase and transferred to SD(-N) at time 0. At the indicated time points, the cells were collected; the metabolites in these cells were extracted and analyzed by LC/MS as described in Materials and Methods. The results are presented as normalized intensities on the basis of peak height of each metabolite in wild-type cells. All data are means of triplicates. The error bars represent the standard deviation.