Figure 1.

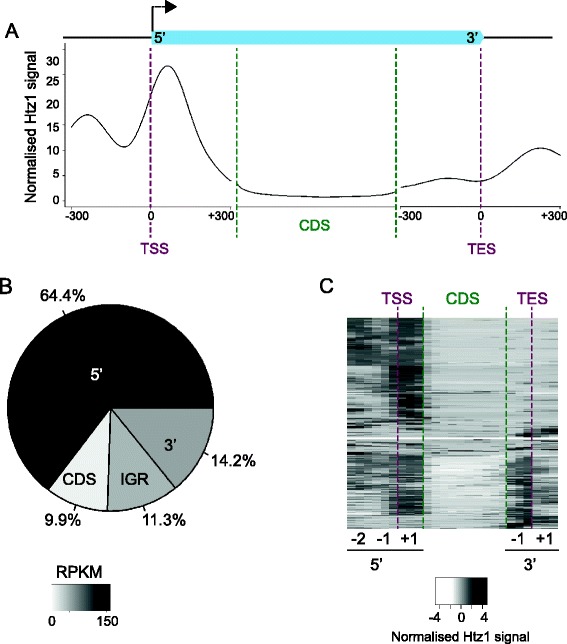
About one-third of Htz1 is localised outside of TSSs. A. Average profile of Htz1 at protein-coding genes, with an average transcript depicted by a light blue box. Genes were aligned according to their TSSs or transcription end sites (TESs) and the average levels of Htz1 (reads per million sequenced reads per gene) were calculated for each base pair. For relative alignments of coding regions (CDS; region >300 bp down/up-stream of TSS/TES), all transcripts were stretched or compressed to a constant length and then the average Htz1 level was found at each relative position. B. The percentages of Htz1 signal located at the 5' end (−300 to +300 relative to TSS), CDS, and 3' end (−300 to +300 relative to TES) of protein-coding genes are shown, along with enrichment in other intergenic regions (IGR; > 300 bp away from a protein coding gene). The darkness of the colour for each category reflects the length-normalised density of Htz1 signal in reads per kilobase per million mapped reads (RPKM). C. Hierarchical clustering of Htz1 binding profiles, highlighting the clusters of genes with Htz1 enrichment at TSSs, CDSs and TESs. A 25-dimensional vector was generated for each transcript, comprising nine 50-bp windows corresponding to the −2, −1 and +1 nucleosomes around the TSS (5' -2, 5' -1 & 5' +1), 10 windows for the coding sequence (CDS) and six 50-bp windows for the nucleosomes flanking the TES (3' -1; 3' +1). Clustering was done using Euclidean distances between the vectors. Data in this figure were generated from one biological replicate, but are essentially identical to a second wild-type biological replicate (Additional file 5: Table S1).
