Figure 2.

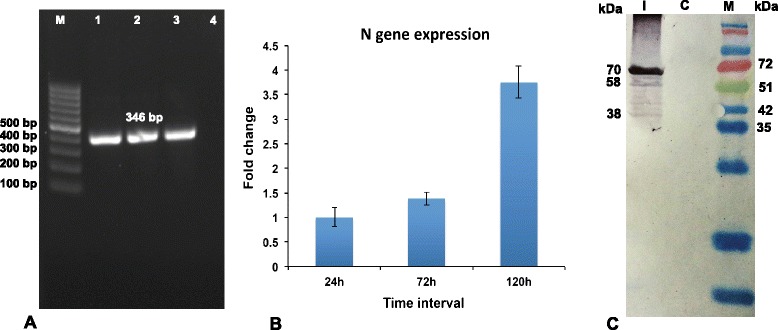
Viral infection in goat PBMCs. A) N gene amplification of 346 bp at 24 h (1), 72 h (2), 120 h pi (3), Negative control (4), M- 100 bp Ladder; B) Expression of N gene expression at 24 h, 72 h, 120 h pi by Real-Time PCR amplification. N gene expression at 24 h pi is taken as calibrator. Expression of N gene significantly (P ≤ 0.01) increased from 24 h pi to 120 pi indicating the increase in viral infection with time. C) Western blot of the infected (I) and control (C) cell lysate at 120 h pi with the polyclonal serum showed viral proteins of 38 kDa(M-protein), 58 kDa(N-protein), 70 kDa(HN-protein), Fusion (F) protein 60 kDa (not marked) between N and HN confirmed viral infection.
