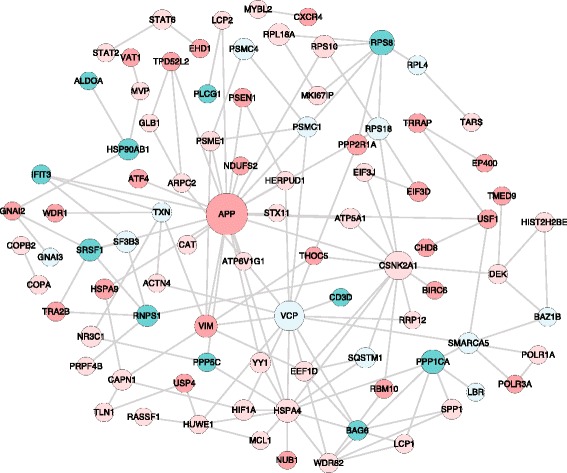
Figure 4.

Protein–protein interaction network for differentially expressed highly connected genes (DEHCNet). Genes that were upregulated and downregulated were shown in green and red colors, respectively, with the gradient showing the extent of expression (log2(fold change) ranging from 1.5 to 5.15 for upregulated and −1.5 to −3.39 for downregulated genes). The diameter of the node represents the connectivity/degree of the node among the 985 differentially expressed genes. Self loops have been removed. CARD11, IRF3, RAC1, UBA2, CLINT1, HERC2, TMEM66, DCAF8, BTG1, MAT2A, HYOU1, POLA1, CD44, ID2 and RB1CC1 genes had no connectivity with other DEHC genes.
