
Figure 1.
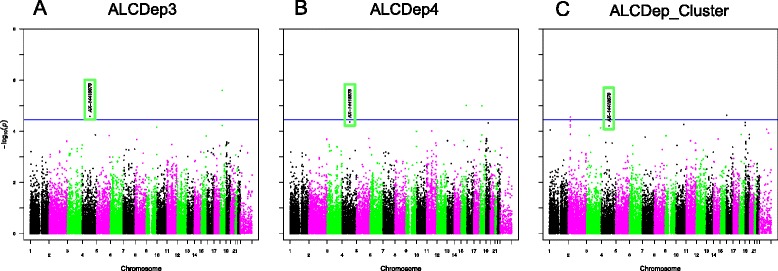
Manhattan plots for alcohol dependence phenotypes. Manhattan plots for alcohol dependence phenotypes: A) ALCDep3 = alcohol dependence as defined by DSM-III-R guidelines; B) ALCDep4 = alcohol dependence as defined by DSM-IV guidelines; C) ALCDep_Cluster = DSM-IV alcohol dependence within 1 year clustering. Minor allele frequency cutoff of 0.05 applied to the plot. Suggestive significance line calculated from GEC software. Green rectangle in plots highlights SNP rs991316.