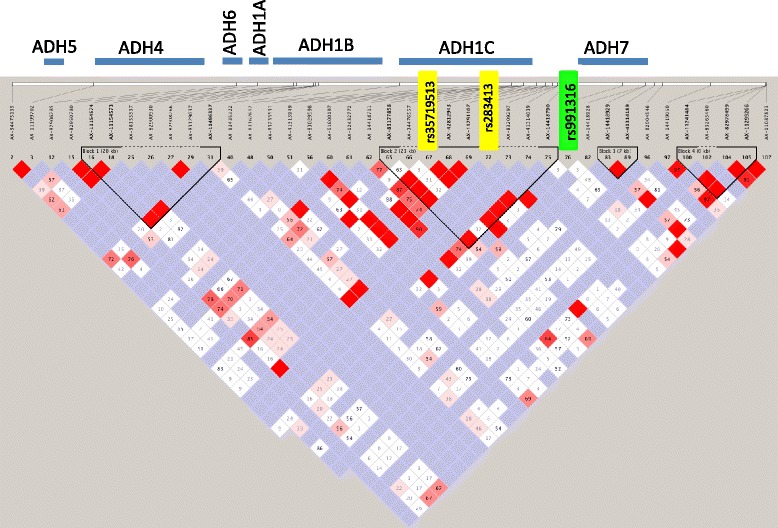
Figure 3.

Linkage disequilibrium (LD) plot across ADH gene cluster. This plot illustrates the linkage disequilibrium between SNPs genotyped across chromosome 4 encompassing the ADH gene cluster. LD was measured using D’. Blue bars above the plot indicate the gene locations. Increasing levels of LD are indicated by pink and red squares, with red squares demonstrating the highest confidence linkage estimates. The green rectangle highlights SNP rs991316. The yellow rectangles highlight the two SNPs in ADH1C that were in LD with SNP rs991316.
