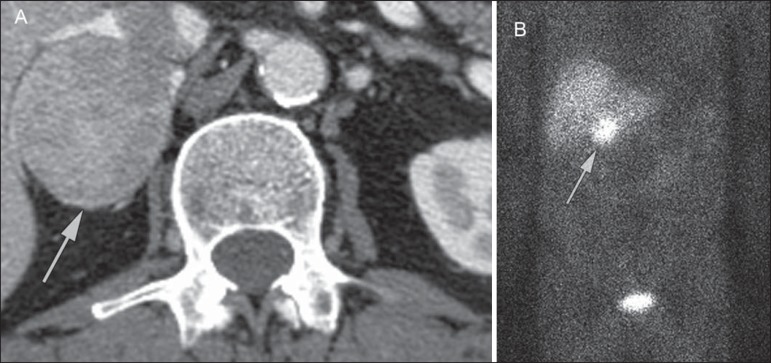
Figure 10.
Pheochromocytoma (arrows). A contrast-enhanced CT image demonstrates a somewhat heterogeneously enhancing adrenal mass (A). Focal increased radiotracer uptake (B) corresponding to the adrenal mass in (A) on coronal 123-I MIBG scintigraphy. Physiologic radiotracer activity in the liver and excretion in the urinary bladder are noted.

