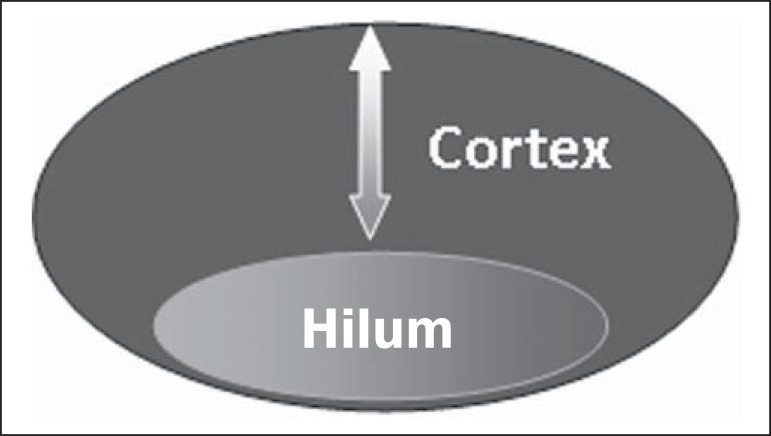
Figure 8.
Representation of a cortex with a normal thickness. Measure of the fatty hilum greater than the cortex thickness.
Figure 9.
Cortical thickening representation. Cortical thickness ≤ fatty hilum thickness.
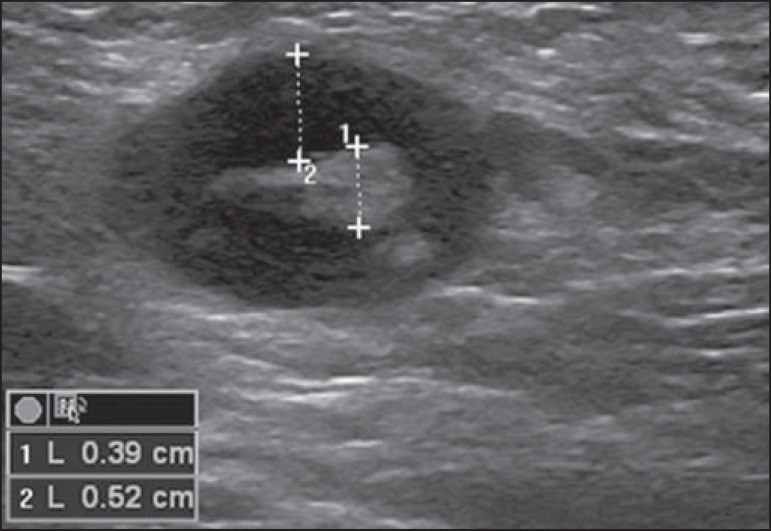
Figure 10.
Lymph node with cortical thickening at ultrasonography. Maximum cortical thickness (2) > hilum thickness (1).


