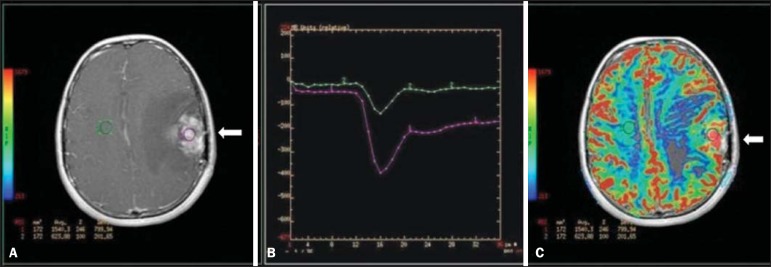
Figure 6.
Dynamic MRI (DSC-MRI) of a high-grade neuroglial tumor (arrow) in a 16-year-old patient. On A, axial post-gadolinium T1-weighted image showing two ROIs: 1 (purple) located in the tumor lesion, and 2 (green) located in the healthy tissue. On B, the respective time-signal intensity curve demonstrates greater perfusion in the tumor region in relation to the healthy tissue (> 2.0). On C, the rBV map superimposed on the contrast-enhanced axial T1-weighted image demonstrates increased perfusion in the tumor ROI (arrow).

