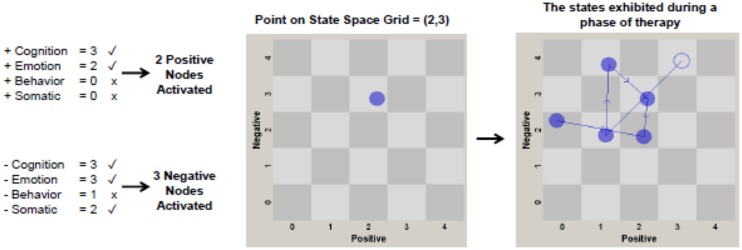
FIGURE 1.
Chart depicting how CHANGE coding variables (positive and negative cognition, emotion, behavior, and somatic functioning) are converted from raw values for an individual patient to points on the state space grid. Each CHANGE variable with a check mark (rather than an x) was coded at a moderate or high level (score of 2 or 3) and therefore is considered “activated.” The number of CHANGE variables (or nodes of each pattern) activated are then used to plot a point on the state space grid. The number of positive pattern nodes activated corresponds to a value on the x-axis, and the number of negative pattern nodes activated corresponds to a point on the y-axis. Two treatment phase grids [phase 1 (sessions 1-10), phase 2 (sessions 11-34)] are plotted for each patient. The grids are used to generate dispersion scores for each patient in each phase of treatment. The panel on the right illustrates a patient with a high dispersion score of 0.868 in the schema-focused phase of CT-PD. Low dispersion scores occur when few cells on the grid are visited, as might occur in the earliest sessions of treatment.

