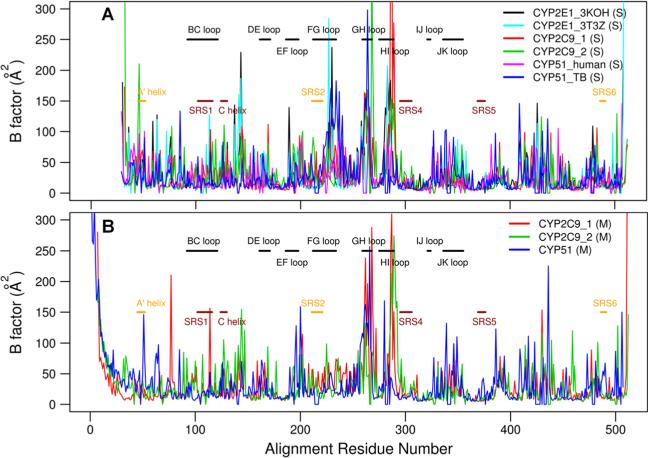
Figure 2.
Comparison of the B-factors of the non-hydrogen atoms of different CYPs with the loop regions (black), the ligand binding cavity residues (dark red), and ligand tunnel opening residues (orange) labeled. The residue numbers of the CYPs correspond to the PROMALS3D alignment (Figure S2). (A) Comparison of B-factors averaged over the last 9 ns of the two simulations with soluble ligand-free forms of the two human CYP2C9 models, the two simulations with the two human CYP2E1 models, and the simulations of T. brucei CYP51 and human CYP51. (B) Comparison of the B-factors averaged over the last 12 ns of the simulations with the membrane-bound ligand-free forms of CYP2C9 and CYP51.

