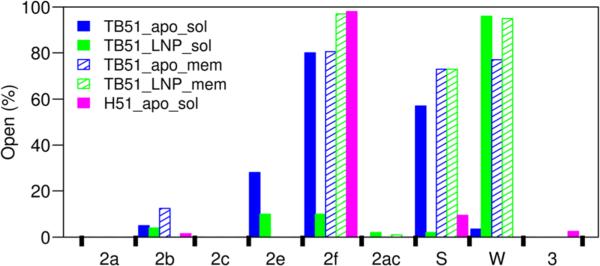
Figure 5.
Percentage of the snapshots in which the ligand tunnels were open in the simulations is shown for the ligand-free soluble T. brucei CYP51 (solid blue), MCP-bound soluble T. brucei CYP51 (solid green), ligand-free membrane-bound T. brucei CYP51 (hatched blue), MCP-bound membrane-bound T. brucei CYP51 (hatched green), and ligand-free soluble human CYP51 (solid magenta). In CYP51s, the tunnels are located as follows: 2a—between the F–G loop, B–B′ loop, and β1–1 sheet; b—between the B–B′ loop, and the β1–2 and β1–4 sheets; 2c—between the G and I helices, B′–C loop; 2ac—between the B′ helix and G helix; 2e— through the B–C loop; 2f—between helices A′, F″, and the tip of the β4 hairpin; 3—between the F and G helices; S—between F, I helices, and the β4 hairpin; and W—helix C and the β-bulge segment.

