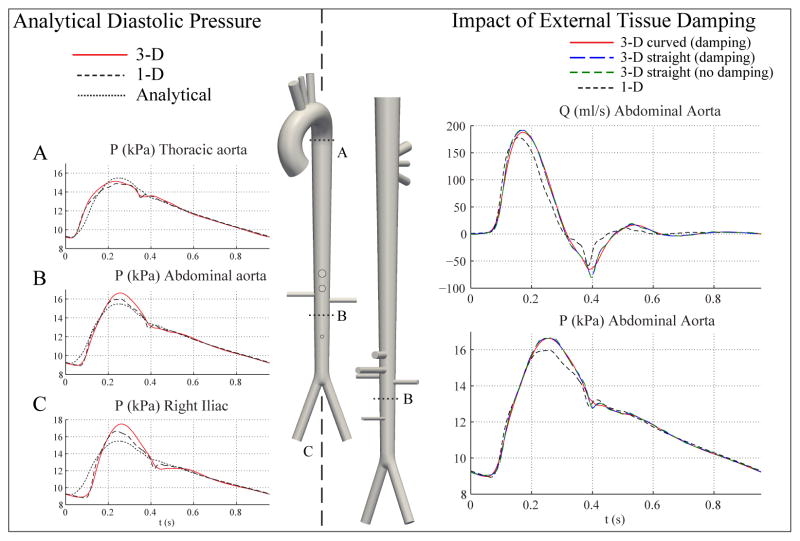
Figure 14.
Left: Analytical prediction of pressure (dotted lines) shows good agreement with 1-D and 3-D models during diastole. Right: Pressure and flow rate at the midpoint of the abdominal aorta for the curved 3-D aorta tree model with external damping (red), the straight 3-D aorta model with external damping (dashed blue), the straight 3-D aorta model without external damping (dashed green), and the 1-D model (dashed black). The level of external damping cs = 300 Pa s m−1 and is identical for all the 3-D models.
The waveforms for the straight 3-D model with and without damping are essentially identical.

