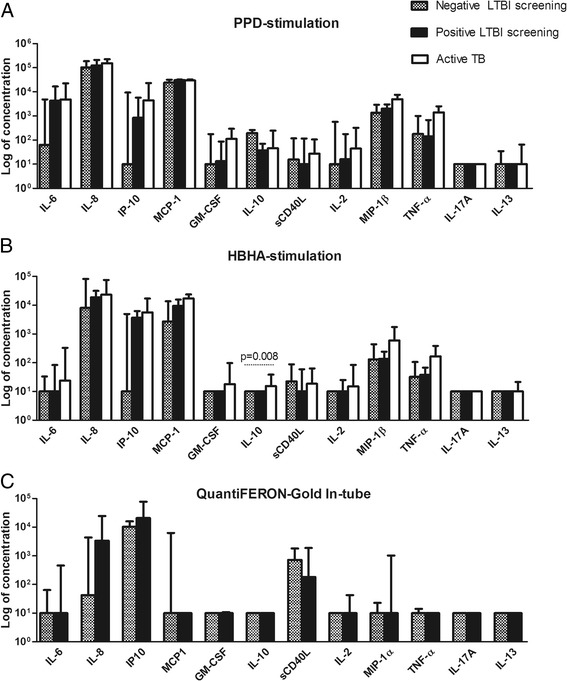
Figure 3.

Multiplex analysis of culture supernatants. A panel of cytokines and chemokines were measured in the culture supernatants of (A) PPD-stimulated peripheral blood mononuclear cells (PBMC), (B) HBHA-stimulated PBMC and (C) the TB Antigen tube of the QFT-GIT. Median concentrations with interquartile ranges are represented in the graph. Results between subjects with a positive LTBI screening (n = 11), subjects with a negative LTBI screening (n = 8) and active TB patients (n = 6) were compared using Mann–Whitney U test or Kruskall-Wallis test. Significant p values are shown.
