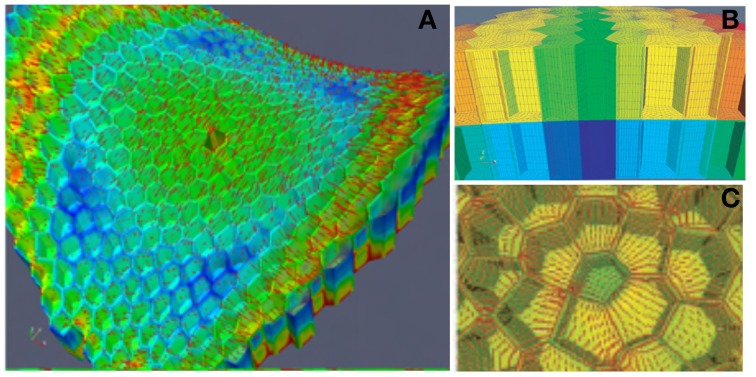
Figure 6.
Finite elements model (FEm) of a patch of the L1 + L2 layer of the SAM. ISM model for the numerical mechanical analysis of a small patch of the SAM with full cellular resolution. The example here displays the model (and the numerical simulation of its stress-field output) of a patch at the boundary between the primordium and the central dome, with the ablation of one L1 cell from Hamant et al. (2008), reprinted with permission from AAAS. (A) General view of the FEm of the patch in the primordium boundary zone from above indicating the simulated pattern of principal stress directions (red lines) on the outer surface of meristem tissue. Colors indicate relative values of stress (blue, low; green, medium; red, high). (B) Side view of the outermost cell layers L1 and L2. (C) Detail of the stress pattern around one hole due to cell ablation.

