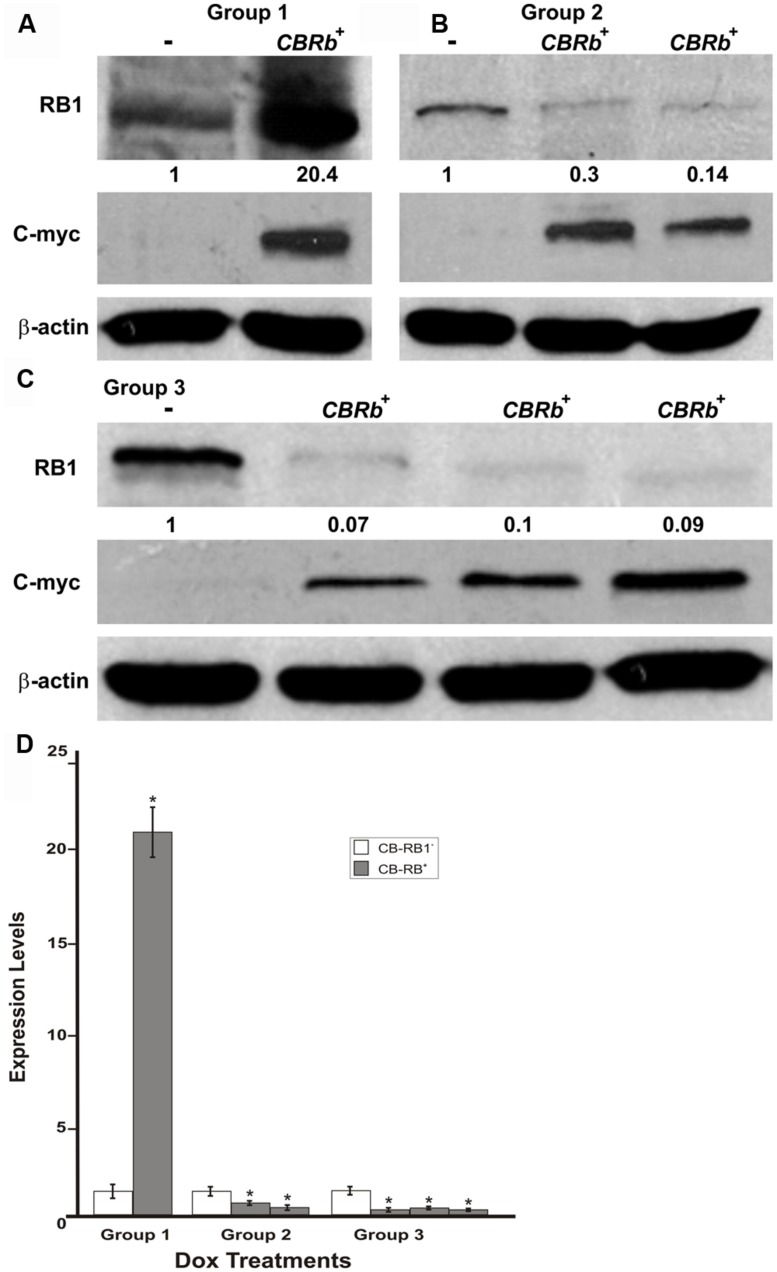
FIGURE 7.
DN-CBRb transgene activation in the inner ear of postnatal (P) 36 DN-CBRb+/ROSA-CAG-rtTA+ (CBRb+) and DN-CBRb-/ROSA-CAG-rtTA+ (CBRb-) mice after 3 (group 1), 7 (group 2), and 10 (group 3) days of Dox treatment. (A–C) Anti-RB1, which reacts with both hyperphosphorylated and hypophosphorylated forms of RB1, as well as anti-c-myc antibodies were used for detection. Densitometric analysis was done using ImageJ software (http://imagej.nih.gov/ij/). The corresponding values obtained were normalized to the negative control CBRb (-) and then to β-actin. The relative RB1 expression levels are shown underneath each blot. (D) Graphic representation of normalized RB1 expression levels plotted against the different treatments highlights a consistently lower RB1 detection in CBRb+ samples. Each lane on the Western blot gel (A–C) and each column on the graphic (D) correspond to a different individual and sample. (-) = CBRb-; *P < 0.05.

