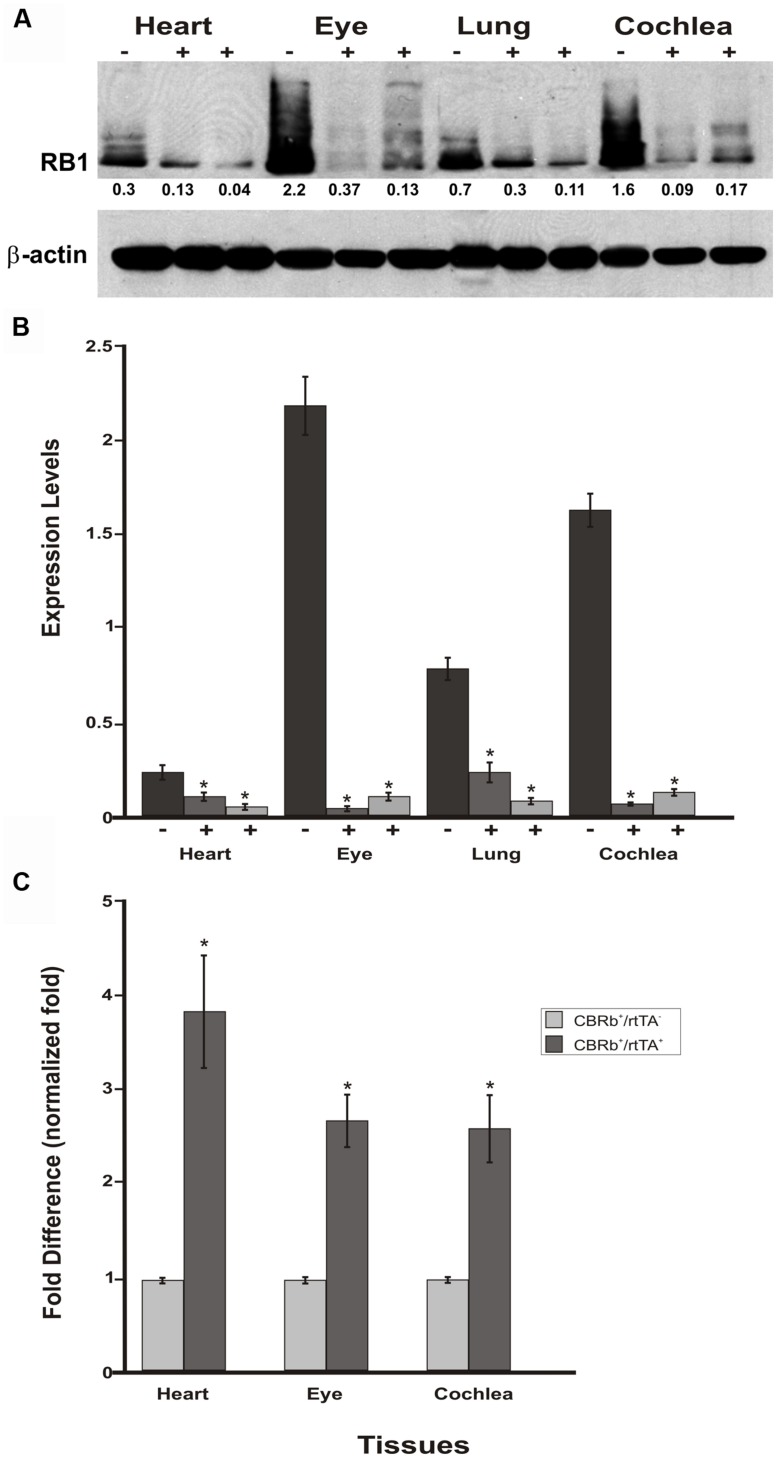
FIGURE 9.
Spatial analyses of the DN-CBRb transgene activation in P18 DN-CBRb+/ROSA-CAG-rtTA+ and DN-CBRb+/ROSA-CAG-rtTA- mice heart, eye, lungs, and cochlea. (A) Confirming efficiency of Dox-mediated transgene activation, expression of the endogenous RB1 was downregulated in the CBRb+/ROSA-CAG-rtTA+ (+) tissues, but not in the CBRb-/ROSA-CAG-rtTA+ (-) control mice tissues. Densitometric analysis was performed as described in Figure 4. The relative RB1 expression levels are shown underneath each blot. (B) Graphic representation of normalized RB1 expression levels plotted against the different tissues. Inter-individual variation on endogenous RB1 levels may explain differences in individual responses to transgene activation and RB1 downregulation. (C) RT-PCR analyses in eye, heart and cochleae revealed significant upregulation of the DN-CBRb transcript in dox-treated DN-CBRb+/ROSA-CAG-rtTA+ tissues, but not in DN-CBRb+/ROSA-CAG-rtTA-. CBRb+/rtTA+ = DN-CBRb+/ROSA-CAG-rtTA+; CBRb-/rtTA+ = DN-CBRb-/ROSA-CAG-rtTA+; CBRb+/rtTA- = DN-CBRb+/ROSA-CAG-rtTA-. *P < 0.05.

