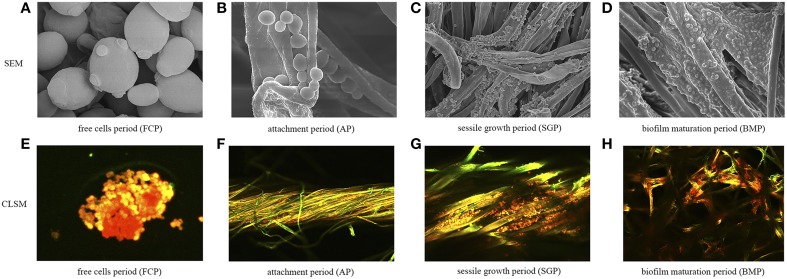
Figure 2.
Temporal biofilm characterization at different periods of biofilm development. (A) SEM images of free yeast cells, used as control throughout this study. (B–D) SEM images of biofilms taken at three different growth periods. (E) CLSM images of free cells. (F–H) CLSM images of biofilms taken at three different growth periods. Strains were dyed orange-red by FUN-1 and polysaccharides were dyed green by Alexa Fluor 488-conjugated ConA.

