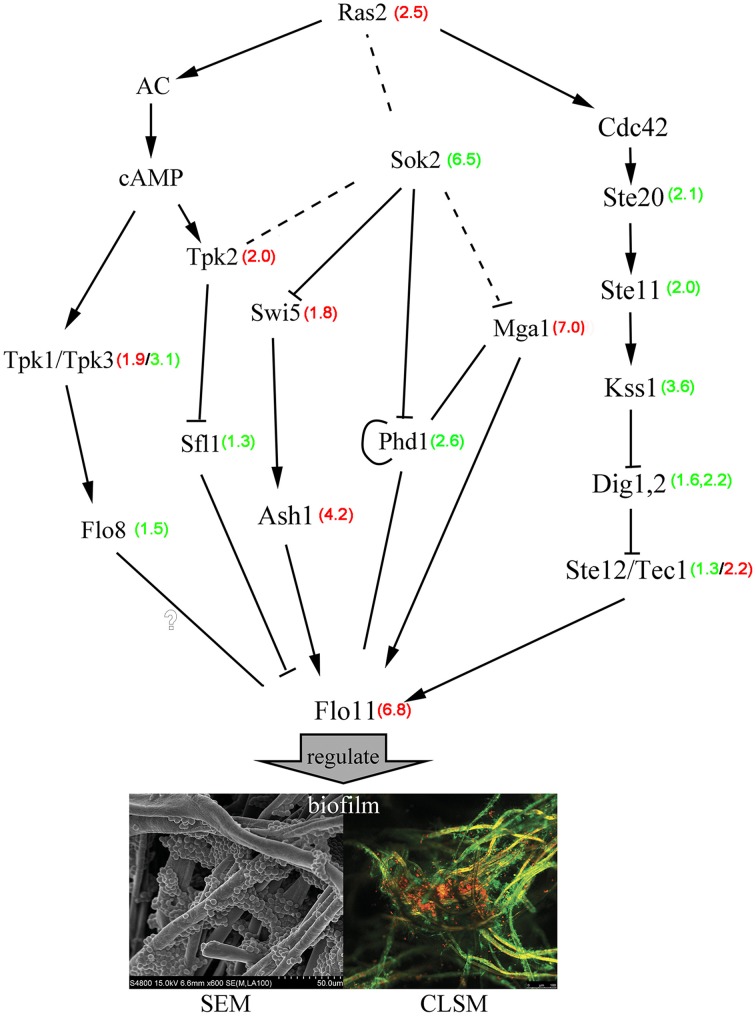
Figure 5.
Hypothetical gene regulation and signaling control in S. cerevisiae biofilms. Red numbers represent the degree of gene up-regulation compared with free cells, and green numbers represent the degree of gene down-regulation compared with free cells. The full lines represented the probable regulation directly and the broken lines represented the probable regulation indirectly.

