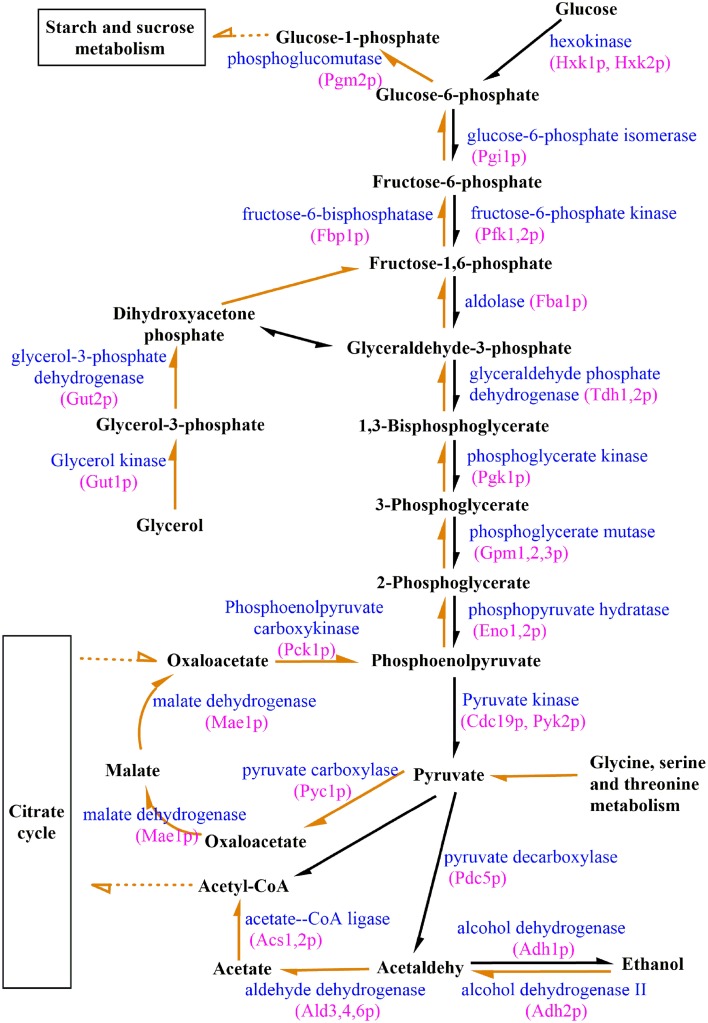
Figure 6.
Differential expression of genes involved in glycolysis/gluconeogenesis during biofilm growth. Orange arrows represent genes involved in gluconeogenesis, and black arrows represent genes involved in glycolysis. The full lines represented the regulation directly and the broken lines represented the regulation indirectly.

