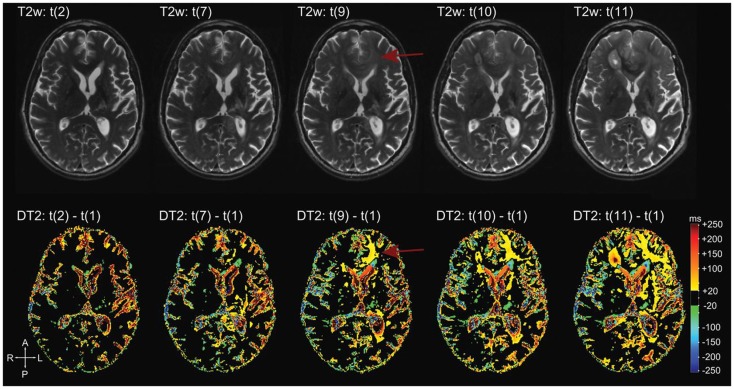
Figure 6.
Differential quantitative T2 maps. Reprinted with permission from Ref. (151), License Number 3520001314812. More apparent changes on the differential T2 map (bottom row) in the left frontal lobe (arrows) compared to T2-weighted images (top row). These changes are hardly visible on conventional T2-weighted images (arrows).

