
Figure 1.
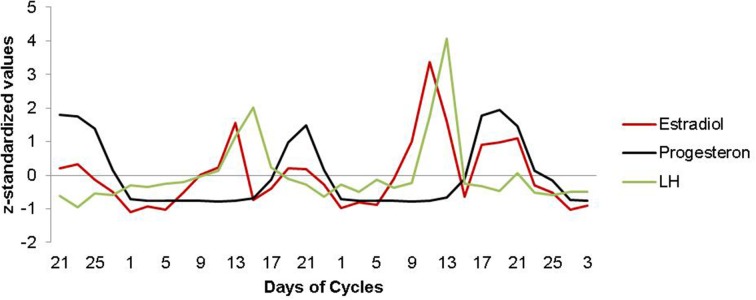
Estradiol, progesterone and LH fluctuation across the menstrual cycle. Characteristic patterns of serum estradiol (red line), progesterone (black line) and LH (green line) levels are displayed across two menstrual cycles. The depicted data represents days of cycle with corresponding z-standardized, single hormone values, matching the single scan time points in chronological order. As expected, estradiol shows a first prominent peak in the periovulatory phase, followed by a second peak in the late luteal phase. LH surges after the peak of estrogen, shortly before ovulation. Progesterone levels are low during the follicular phase and high during the luteal phase.