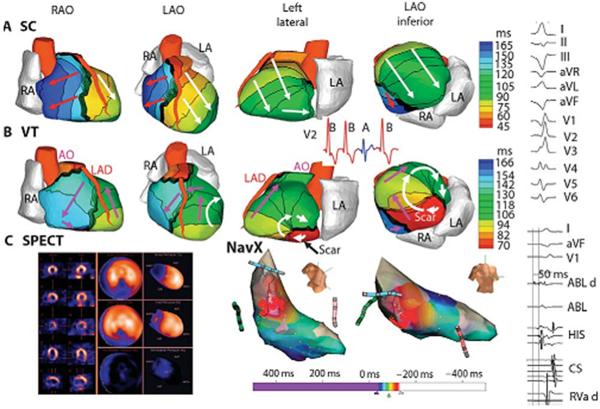
Figure 10.
Example of ECGI reentrant VT from inferobasal scar. (A) Four views of activation sequence during a sinus capture (SC) beat (blue on the V2 ECG). Arrows indicate direction of the activation wavefronts. (B) Activation sequence during VT beats (red on the V2 ECG). White arrows indicate a clockwise lateral loop (left lateral and left anterior oblique inferior views); purple arrows show propogation into the RV in a counterclockwise fasshion. (C) (left) SPECT images showing a scar at the inferobasal LV region (blue). (Right) Limited invasive endocardial map of VT activation (red, early;blue late). (Right column) (Top) Twelve-lead surface ECG during VT. (Lower) Ablation catheter signals. The earliest electrogram signal is seen at the inferoseptal border zone, 50 ms before the onset of the surface QRS. ABL d, bipolar electrogram at the distal ablation catheter; HIS, AV junction/His bundle; CS, coronary sinus; RVa d, right ventricular apex. (From Wang Y, Cuculich PS, Zhang J, Desouza KA, Vijayakumar R, Chen J, Faddis MN, Lindsay BD, Smith TW, Rudy Y. Noninvasive electroanatomic mapping of human ventricular arrhythmias with electrocardiographic imaging (ECGI). Science Transl Med 2011;3:1–10; with permisson.)

