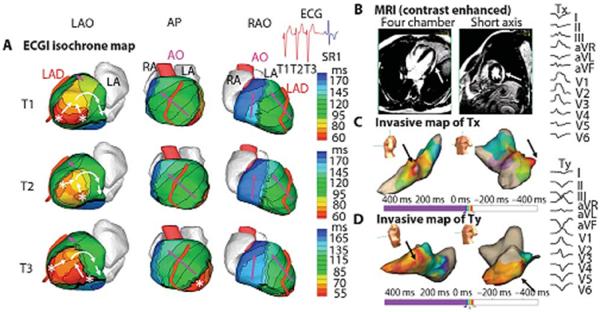
Figure 12.

Example of ECGI of reentrant VT in LV lateral wall in infiltrative cardiomyopathy. (A). ECGI isochrone map. Activation patterns for three consecutive VT beats (T1, T2, and T3). ECGI identified two distinct areas of early epicardial activation (white asterisks), which differered from beat to beat. The propagation pattern varied somewhat depending on the relative contribution of the two sources, but for all beats, the wavefront turned clockwise and propagated to the LV lateral base with a high degree of curvature, where it reached a line of block in the infero-lateral base. (B) A gadolinium-enhanced MRI revealed a patch of myocardial enhancement in the lateral LV (white arrows), consistent with focal myocarditis or cardiac sarcoid. (C) Invasive electroanatomic map created during the presenting VT (arbitrarily named Tx). The region of earliest activation is shown by black arrows. (D) Invasive electroanatomic map created during a different VT (arbitrarily named Ty) after initial ablation at the site of earliest activation. The earliest activation (black arrows) is shifted more apically. (Right) Twelve-lead ECGs of two VT morphologies (Tx and Ty). AP, anterior-posterior view; SR1, first sinus rhythm beat after VT. (From Wang Y, Cuculich PS, Zhang J, et al. Noninvasive electroanatomic mapping of human ventricular arrhythmias with electrocardiographic imaging (ECGI). Science Transl Med 2011;3:1–10; with permisson).
