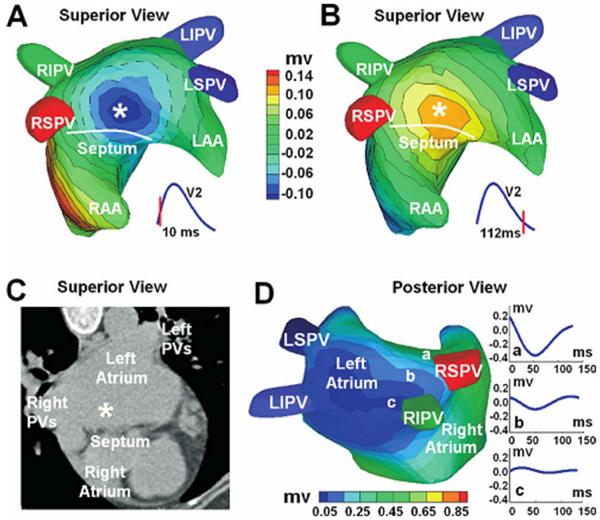
Figure 13.
ECGI three-dimensional voltage and electrogram maps of focal atrial tachycardia (AT). A and B: Atrial epicardial potential maps at 10 and 112 ms after the onset of the surface P wave. Panel A captures the epicardial breatkthrough pattern during activation, and panel B shows the repolarization pattern with reverse polarity. The white asterisk indicates the site of earliest activation as predicted by ECGI. Panel C shows the ECGI-determined earliest activation site (white asterisk) on a CT image of the atria. Panel D is an electrogram magnitude map (peak-to-peak) reconstructed by ECGI (posterior view). The dark blue represents a region of low-magnitude electrograms, indicating a scar region. Three electrograms selected from a nonscar region (a) and from the scar region (b, c) are shown. Location of the low-magnitude electrograms is consistent with prior PV isolations and left atrial substrate modification. RIPV = right inferior PV; LIPV = left inferior PV; RSPV = right superior PV; LSPV = superior PV; LAA = left atrial appendage; RAA = right atrial appendage. (From Wang Y, Cuculich PS, Woodard PK, et al. Focal atrial tachycardia after pulmonary vein isolation: noninvasive mapping with electrocardiographic imaging (ECGI). Heart Rhythm 2007;4:1082–1084; with permisson.)

