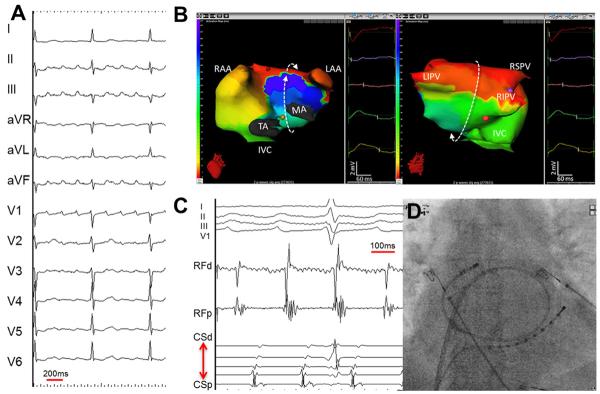
Figure 17.

Left atrial roof-dependent AT. (A) A 12-lead electrocardiogram of clinical tachycardia. (B) an ishochronal activation of electrocardiomap of a typical macro-reentrant roof-dependent AT. The below to upward activation of the anterior wall of the left atrium is shown on the left and the top to bottom activation of the posterior left atrium is shown on the right. The bystander right atrial free wall is activated from above downward. The entire tachycardia cycle length is covered along the AT circuit, and the morphologies of the virtual unipolar electorgrams displayed from 5 atrial sites distributed along the trajectory of the macro-rentry concur with this activation pattern (C) intracardiac electrograms from the left atrial roof and coronary sinus recorded during the ablation of roof-dependent AT. (D) Postero-anterior fluoroscopic image showing the location of the intracardiac catheters. LAA = left atrial apendage; MA = mitral annulus; RAA = right atrial appendage; SVC = superior vena cava; TA = tricuspid annulus. (From Shah AJ, Hocini M, Xhaet O, et al. Validation of novel 3-dimensional eletrocardiographic mapping of atrial tachycardias. Invasive mapping and ablation. A multicenter study. J Am Coll Cardiol 2013:62-889-97; with permisson)
