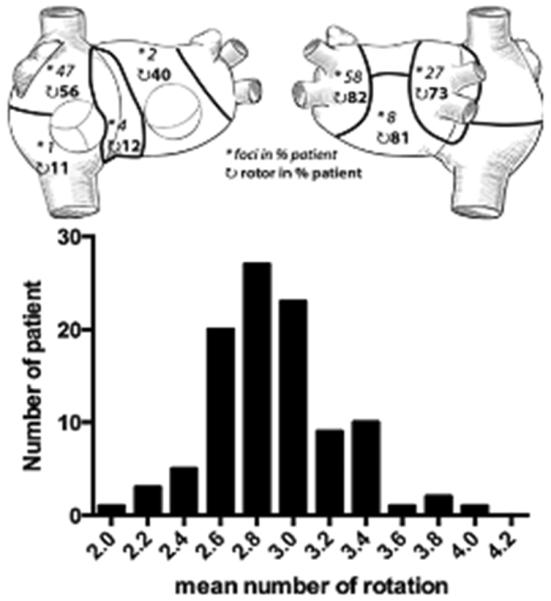
Figure 20.

Persistent AF. Top. Distribution of drivers (focal breathroughs, asterisk; reentry events, curved arrows) in 7 regions is reported as the percentage of patients. For example, 82% of the 103 patients had repetitive reentries, and 58% had repetitive focal breakthtroughs in the left pulmonary vein-appendage region. Bottom. Bar diagram shows the distribution of the mean number of rotations in 103 patients. (From Haissaguerre M, Hocini M, Denis A, et al. Driver domains in persistent atrial fibrillation. Circulation 2014:130:530–538; with permisson.)
